

Table of contents
In this tutorial, you'll go through the main features of Visual Studio Code (VSC). In particular, you'll learn:
- how to open a folder containing a project files.
- the main components of the VSC interface.
- how to execute a Python script (with and without arguments).
- how to install a Python package or module.
- how to use a debugger.
In this lab, we assume that the interface of your VSC installation is in English.
If your interface is in French we strongly recommend you to switch to English:
1. click on the Affichage menu (in the top menu bar);
2. select Palette de commandes;
3. in the text field that appears, type the command Configurer le langage d'affichage.
4. select English and restart VSCode.
👉 If you intend to keep the interface in French, then follow the French version of this lab (click on the French flag in the top-left corner of this window).
1. Preliminaries
👉 Download this archive file to your computer.
An archive file is composed of one or more compressed files along with metadata.
👉 Move the downloaded file from the Downloads folder to
a folder on your computer where you usually keep your documents.
We strongly encourage you to create a dedicated folder for this course.
You should also organize this folder into several subfolders: for instance,
a subfolder for each lab session (e.g., lab0, lab1...), a subfolder containing
the slides and the handout...
As Benjamin Franklin said, "For every minute spent in organizing, an hour is earned.".
👉 Uncompress the file:
- If you use Windows, you can right-click on the file and choose
Extract all. - If you use macOS, you can simply double-click on the file. It is also possible that the file is automatically uncompressed by your operating system after the download.
👉 After uncompressing the file, you should get a folder named lab0code.
2. A quick tour of VSC
VSC is a code editor that provides several functionalities to support software development.
👉 Launch VSC in the same way you would launch any other program on your computer.
A window like the one shown in Figure 1 should appear.
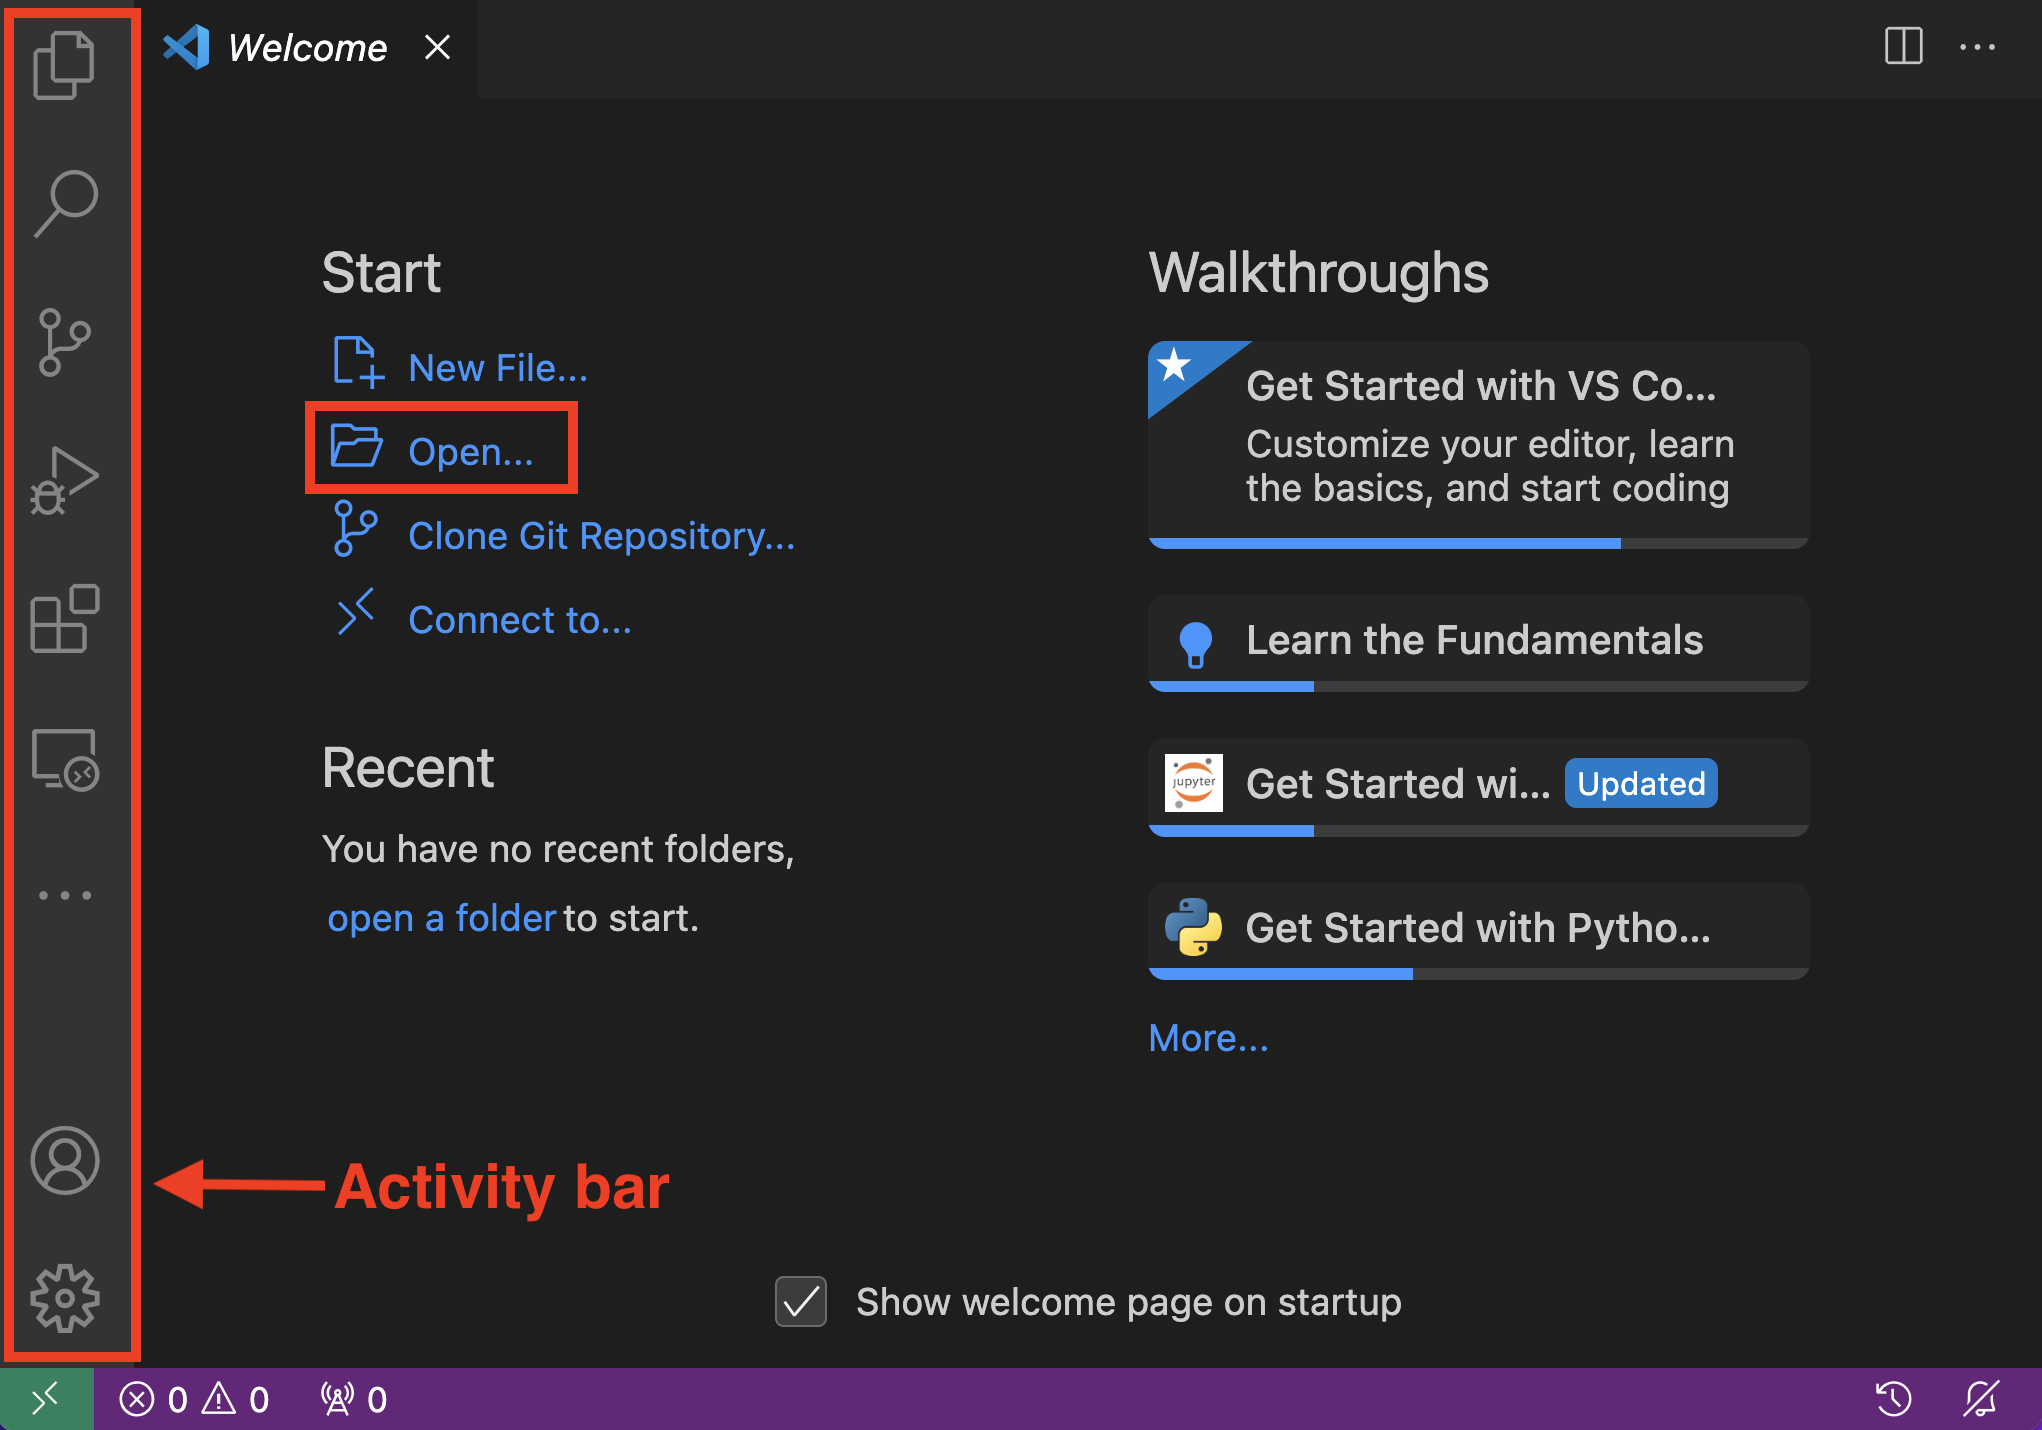
Figure 1. Welcome page of VSC.
The Activity Bar contains the following buttons:
- The Explorer button
 gives you access to the
 Exlorerpanel, where your files will appear when you open a folder. - The Search button
 opens the
 Searchpanel, where you can search text across the files of an opened folder. - The Source Control button
 opens the
 Souce Controlpanel, where you can track changes in your files usingGit(you'll study Git in Lab 2). - The Run and Debug button
 gives you access to the VSC debugger.
- The Extensions button
 opens a panel where you can install and manage VSC extensions. Extensions are modules that add functionalities to VSC.
Depending on the extensions that you installed, the activity bar may include other icons.
2.1 Open a folder
👉 Open the folder lab0code in VSC: click on Open... in the welcome page (see Figure 1) and search for the folder by using the file chooser that pops up.
Instead of clicking on Open..., you can simply simultaneously press the keys CTRL+o (in Windows) or Cmd+o (macOS).
The files in the opened folder (the root folder of the project) appear in the VSC Explorer panel, as shown in Figure 2.
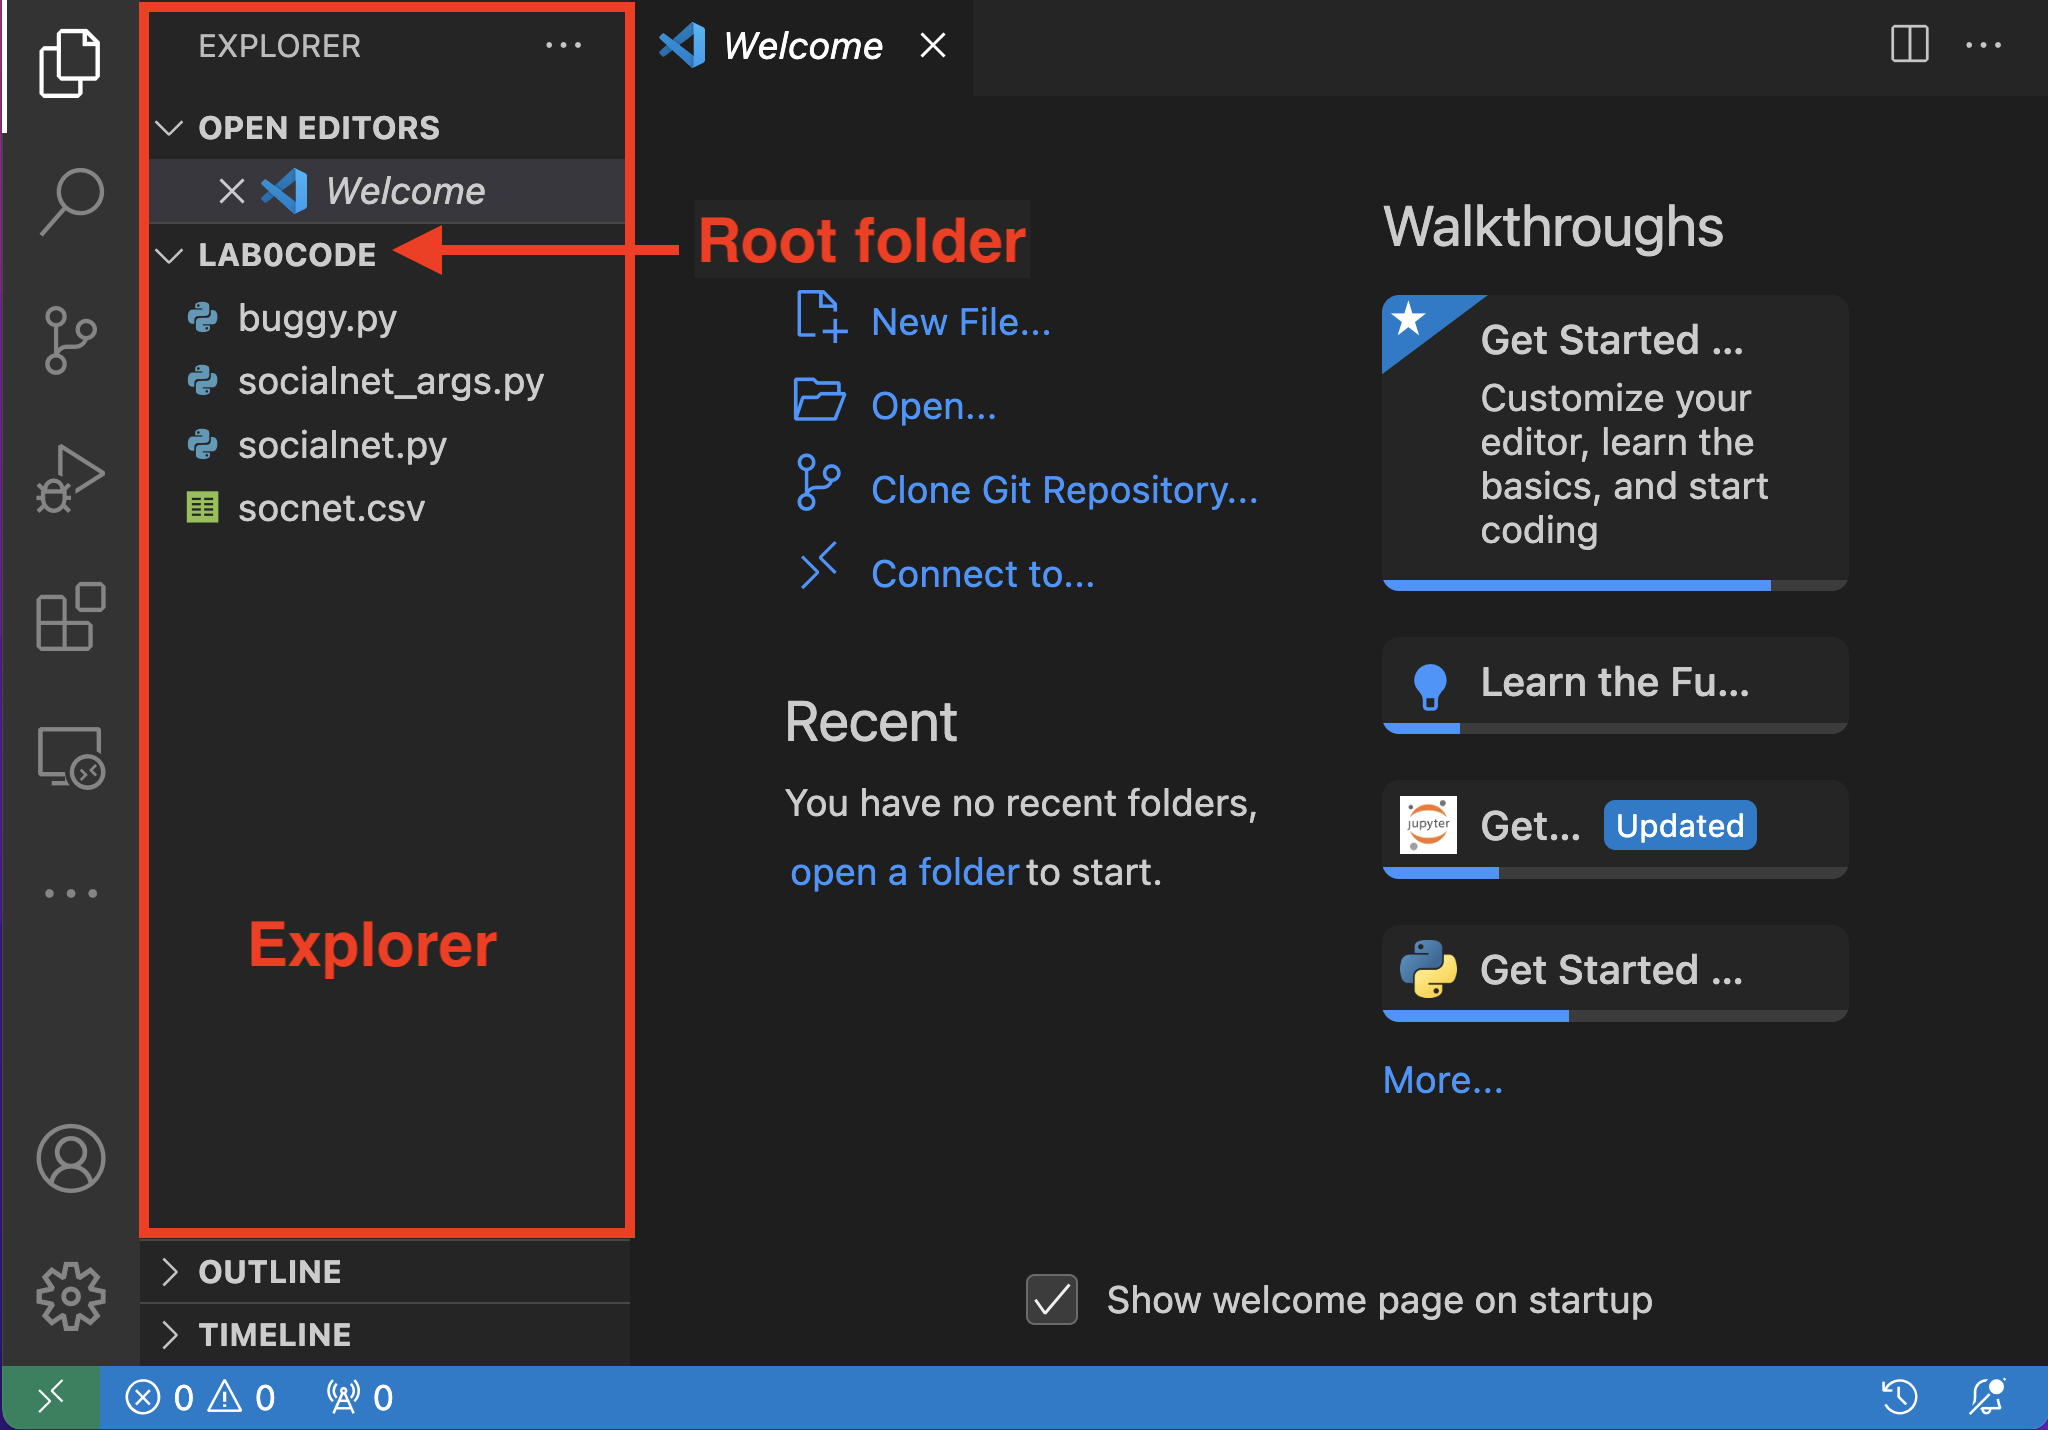
Figure 2. The VSC
Explorer panel.3. A quick look at a Python code
👉 In the Explorer, click on file socialnet.py.
The file opens in a tab in the right part of the VSC window.
In this file, you'll find the definition of a function named common_friends() and,
right after the definition, a code that calls the function:
calling a function triggers the execution of its instructions.
What does the code? The names of the variables are such that you should be able to understand the code.
In particular:
- what is the type of the argument of the function
common_friends()? - what is the type of the variable returned by the function
common_friends()? - describe the output of the function.
ANSWER ELEMENTS
The function common_friends() takes a social network as an argument and then returns the list of common friends
between any two individuals in the social network.
Even if one doesn't understand the whole code, the use of meaningful variable names helps understand the purpose of the function.
In particular:
- The function
common_friends()takes in a dictionary. Each key of this dictionary is the identifier of an individual, the associate value is the list of friends of that individual. - The function
common_friends()returns another dictionary. Each key of this dictionary is a pair of identifiers(a, b), the associated value is the list of common friends ofaandb.
This simple example shows the utter importance of giving variables a meaningful name. It makes understanding the code so much easy!
We now want to execute the code. But before we do so, let's say few words about the Python environment.
4. The Python environment
A Python application is a set of Python source files, which are normal text files.
A source file is called:
- a script, if it can be run directly. The file
socialnet.pyis a script. - a module, if it contains the definition of variables and the implementation of functions that can be imported into other source files.
A file can be both a script and a module.
A package is a group of related modules that together implement a certain functionality.
- Modules in a package are often organized into a hierarchy of folders and subfolders.
- An example of package is
matplotlib, which contains the necessary modules for creating static, animated, and interactive visualizations in Python.
The term library is often used as a synonym of package.
To execute a script, you need a Python environment.
You should already have downloaded and installed one from python.org.
The installation includes:
- a Python interpreter. An interpreter is a software application that is able to understand a program written in a programming language and execute it.
- the Python standard library, that provides useful functions, types (e.g., integers, strings), modules and packages. The list of what is included in the standard library is available here.
- a package installer called
pip, a tool for downloading and installing additional Python packages and modules not included in the standard library.
By default, pip connects to an online repository of public packages, known as
the Python Package Index. pip can also be configured to connect to other repositories.
👉 Depending on your past use of Python, several Python environments may be installed on your computer. Let's check whether this is the case:
- Open the VSC command palette: if you're on Windows, press simultaneously the keys
Ctrl+Shift+Pon your keyboard; if you're on macOS, press simultaneouslyCmd+Shift+P. Alternatively, you can click on the menuView(on the top menu bar) and selectCommand palette. - A text field should appear at the top of the VSC window. Type the following command:
Python: select interpreter. - The list of Python interpreters installed on your computer should appear. For each, you should also see the path to the folder where the interpreter is installed.
- The Python interpreter currently in use should be highlighted. Make sure the highlighted interpreter is the latest version that you installed.
5. Execute the code
Select the tab where the script socialnet.py is open.
The current Python interpreter should be visible in the bottom right corner of the window (see Figure 3).
👉 The version that you see in the figure is older than the version you should have.
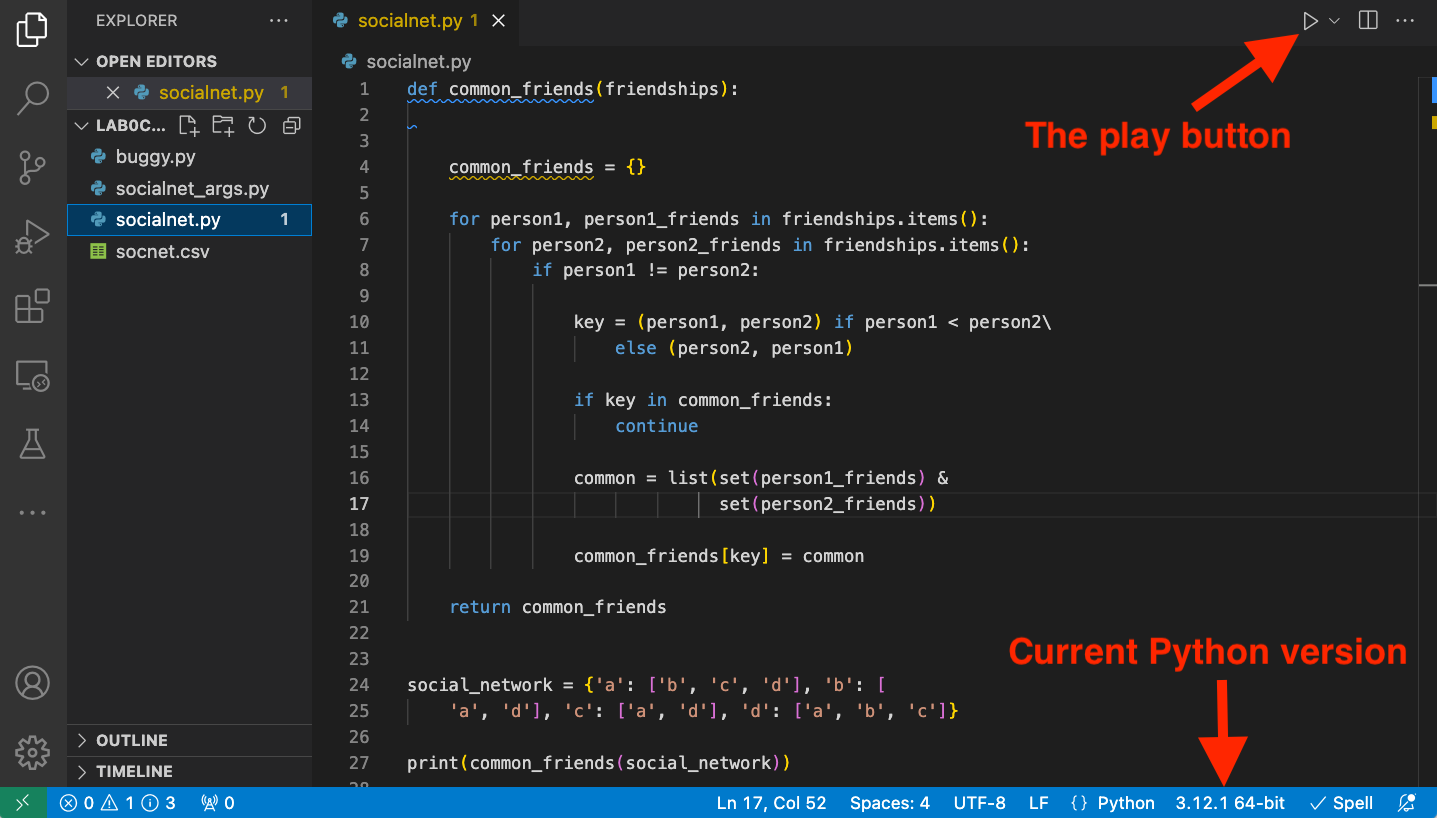
Figure 3. Running Python code in VSC.
👉 Click on the Play button (see Figure 3) to execute the currently selected script (socialnet.py).
A terminal should automatically appear at the bottom of the window, where the output of the program is shown.
If the Play button does not appear, you might not have installed the Python extension in VSC.
5.1 Using the terminal
A terminal is a textual interface, where you can type commands to interact with the operating system.
Since you executed a script in the previous section, the terminal should now be visible at the bottom of the VSC window.
If that's not the case, you can still open a new terminal by clicking on the menu Terminal (in the top menu bar) and selecting
New Terminal.
👉 Let's look at how we execute a Python script from a terminal.
Windows users, click here
Type the following command to invoke the Python interpreter and print its version:
py --version
If you get a Command not found error, try the following command:
python --version
macOS users, click here
Type the following command to invoke the Python interpreter and print its version:
python3 --version
Is the version of the Python interpreter output by the command the same as the version that is indicated in the interface of VSC? In case of a negative answer, select in VSC the correct Python interpreter, as discussed above.
👉 In case of a positive answer to the previous question, execute the script socialnet.py.
Windows users, click here
Type the following command:
py socialnet.py
or
python socialnet.py
macOS users, click here
Type the following command:
python3 socialnet.py
5.2 Passing arguments
You can pass any number of arguments to a Python script.
In the code, you can access the arguments via sys.argv, a variable defined in module sys (part of the Python standard library) that holds the arguments as a list of strings.
More specifically:
sys.argv[0]is the name of the script (socialnet_args.pyin our example).- Any argument that you pass to the script will be available in sublist
sys.argv[1:].
👉 Open file socialnet_args.py in VSC.
The file contains the definition of a function common_friends() (same as in script socialnet.py),
where the social network is read from a file whose name is obtained as an argument.
Take a moment to read the code from line 25 and comment it with your lab supervisor.
Note that in folder lab0code there is a CSV file socnet.csv that contains a simple social network.
Execute socialnet_args.py in VSC by clicking on the play button.
What do you get?
👉 If you try to execute the script from the terminal, you get the same result.
ANSWER ELEMENTS
- A message is displayed saying that the script expects an argument, which we didn't specify.
- Note that the displayed message is the one that we specified in the code of the script (lines 25-26).
- If we hadn't written these two lines in the code, we would have got an error from the Python interpreter (you can try it: just comment out the two lines and run the script again).
👉 When writing a program code, we should always anticipate error conditions and manage them. The end user of the program prefers to receive clear error messages instead of the somewhat obscure errors of a Python interpreter.
👉 sys.exit() is a function defined in module sys that terminates the execution of the script. The function takes as an argument any object. Here we pass an error message.
Another common way to call sys.exit() is to pass an integer status code: the value zero is considered as a successful termination and any nonzero value is considered as an abnormal termination by the terminal.
👉 Run the script via the terminal by typing the following command:
Windows users, click here
py socialnet_args.py socnet.csv
or
python socialnet_args.py socnet.csv
macOS users, click here
python3 socialnet_args.py socnet.csv
You can also execute the script via the Play button, but you need to create a configuration to
pass the arguments.
This method is more involved and we don't recommended it in this course.
You can find out more about this method in this video.
6. Installing packages and modules: virtual environments
If you want to download and install new modules or packages that are not part of the standard Python library, you can use pip.
You can see the list of all packages available in the Python Package Index via the following command:
pip list
Each package has a version number X.Y.Z, where:
- X is the major version number;
- Y is the minor version number;
- Z is the patch number.
This scheme is referred to as semantic versioning. Rules state that we increment:
- the major version number, when backward-incompatible changes are applied to the package.
- the minor version number, when a new backward-compatible functionality is added.
- the patch version number, when backward-compatible bug fix is introduced.
The configuration script for Visual Studio Code provided on Edunao (the one that you run when you installed the software) downloads and installs
modules and packages used in this course and beyond.
When using Python on a regular basis, you might need to install additional packages and modules, some of which
only for short-lived activities, such as a project, or even only a tutorial.
As a result, your Python environment may quickly be cluttered with a lot of packages and modules, often with different versions, that you rarely use.
To avoid this situation, a good practice is to create a virtual Python environment (venv in short) for each Python project; all dependencies of the project (the collection of modules and packages needed in the project) will be installed only in the virtual environment; these installations will not alter the original Python environment installed on your computer.
Create a virtual environment
You need to type a command in the terminal to create a virtual environment.
Windows users, click here
Type the following command:
python -m venv venv
or:
py -m venv venv
macOS users, click here
Type the following command:
python3 -m venv venv
The previous command:
- invokes the module
venvthat manages virtual environments. - creates a new directory called
venv(the last argument of the command, you can change that name if you want) containing the files of the virtual environment.
Activate a virtual environment
You need to activate the virtual environment to use it.
Windows users, click here
Type the following command:
venv\Scripts\Activate.ps1
macOS users, click here
Type the following command:
source venv/bin/activate
The prompt of your terminal should now display the string (venv)(base).
Install a module
Let's install the module pyperclip, that we'll use in Lab 4.
Windows users, click here
Type the following command:
py -m pip install pyperclip
or:
python -m pip install pyperclip
macOS users, click here
Type the following command:
python3 -m pip install pyperclip
👉 The previous command installs the new module only in the current virtual environment.
If you look at the web page of pyperclip in the Python Package Index,
you'll see that the suggested command to install the module is:
pip install pyperclip
While this command is way easier than the one that you typed before, you may only use it if you're sure that
the command pip refers to the current Python environment.
If you only have one Python environment installed on your computer,
you can safely use it. Otherwise, we recommend using the command suggested above.
Let's verify that pyperclip is now available in the virtual environment:
- Type
py(on Windows) orpython3(on macOS) and then press theReturnkey. This will open a Python shell, using the Python interpreter of the virtual environment. - Type the following Python instruction:
import pyperclip; press theReturnkey. - Type the following Python instruction:
pyperclip.__version__; press theReturnkey; this should display the module version. - Type
exit()to exit the Python shell and return to the operating system shell.
Deactivate the virtual environment
Type the command deactivate in the terminal. Your prompt should not display the word (venv) anymore.
Now, when you type the command py or python3 you'll open a shell using the global Python environment installed on your computer.
Type again the commands to display the pyperclip version; you should now get a ModuleNotFoundError.
7. Debugging
When we write code in Python or, for that matter, in any other programming languages, we're likely to make mistakes that will inevitably cause undesired and unexpected results. These mistakes are commonly referred to as bugs.
The process of looking for bugs in a code is referred to as debugging; any software tool that assists us in debugging is called a debugger. When you set VSC up, you installed the Python extension that also includes a powerful Python debugger.
👉 Open the script buggy.py.
The script contains a buggy implementation of Insertion Sort, a famous algorithm for sorting a list of elements.
👉 Execute the script.
You should confirm that the result of the script is indeed not what you would expect.
👉 Configure the debugger.
1. Select the Run and Debug icon ![]() in the
in the Activity Bar.
2. The debugger needs a configuration file named launch.json. Create one by clicking on create a launch.json file (Figure 4).
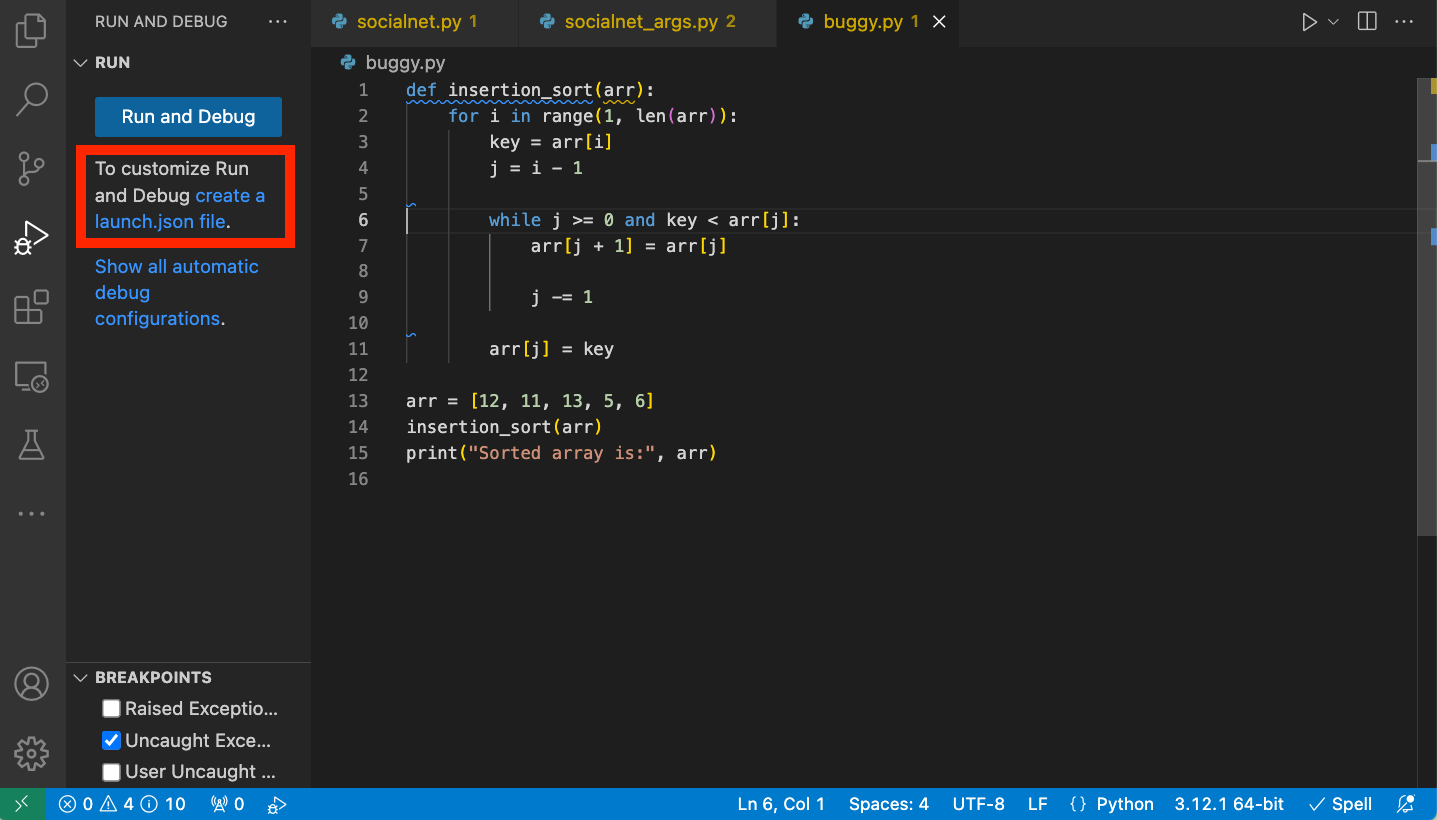
Figure 4. Creation of a configuration file for the debugger.
3. A text field appears at the top of the window. Select Python debugger (Figure 5).
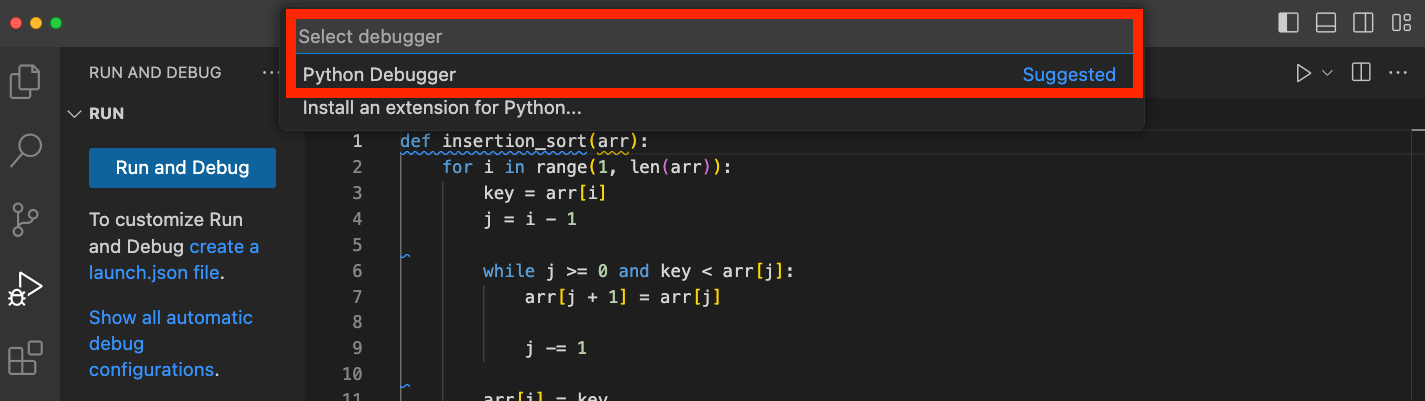
Figure 5. Selection of the Python debugger.
4. Another text field appears where you can choose the debug configuration. Select Python file Debug the currently active Python file (Figure 6).
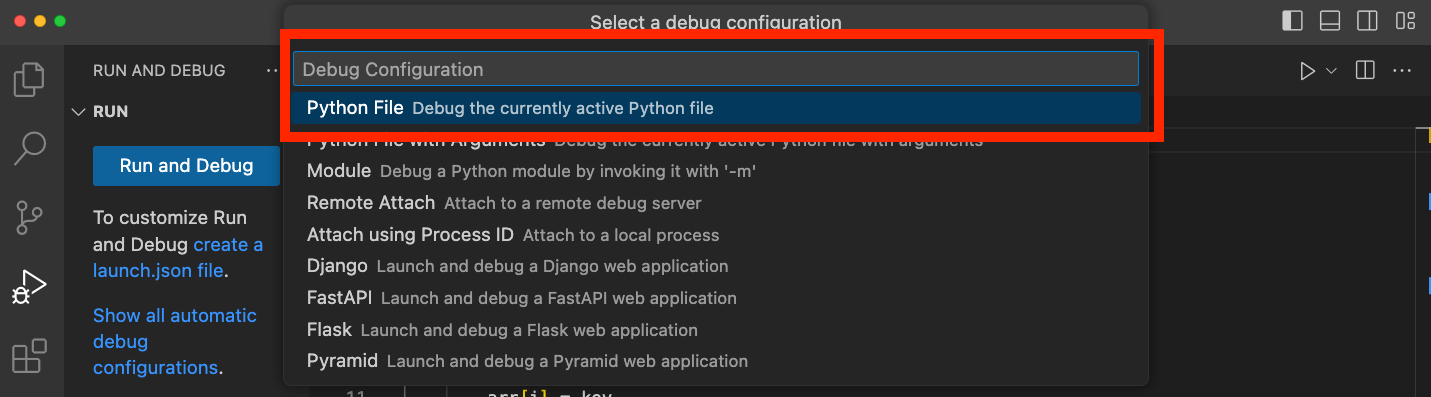
Figure 6. Selection of debug configuration.
The configuration file launch.json is shown in a new tab. This file is stored under folder lab0code/.vscode.
👉 Start the debugger (Figure 7).
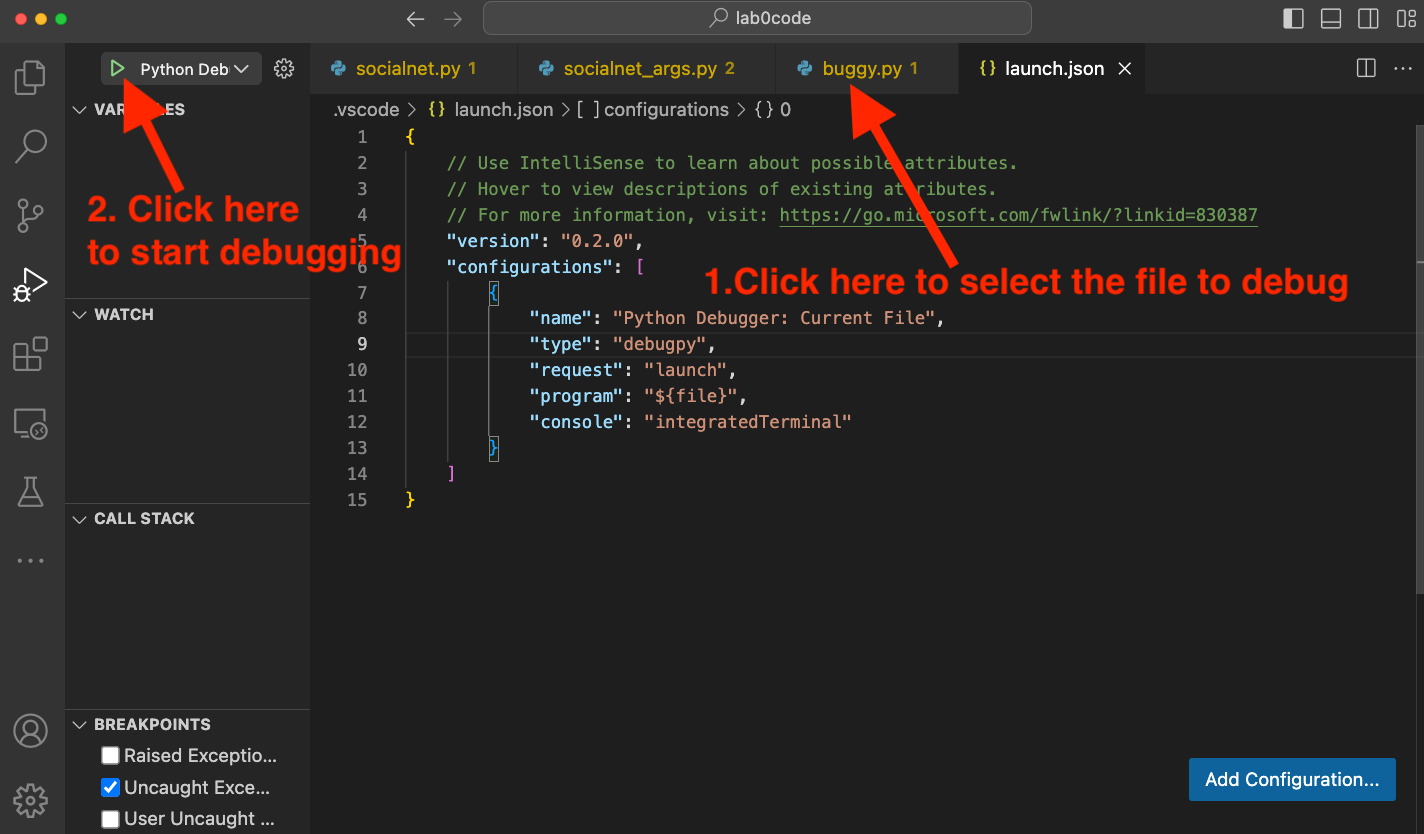
Figure 7. Start the debugger.
🤔 Did you notice that the script buggy.py is executed and stops when it finishes its execution, and we didn't have any time to debug the code?
That's where breakpoints come into play.
7.1 Breakpoints
A breakpoint points to an instruction of a program where the debugger pauses the execution. When the program is paused, the developer can look at the current values of the variables in the hope of getting some clues as to the reason of the bug.
👉 Add a breakpoint at the beginning of the for loop, by clicking on the left margin of the editor (Figure 8).
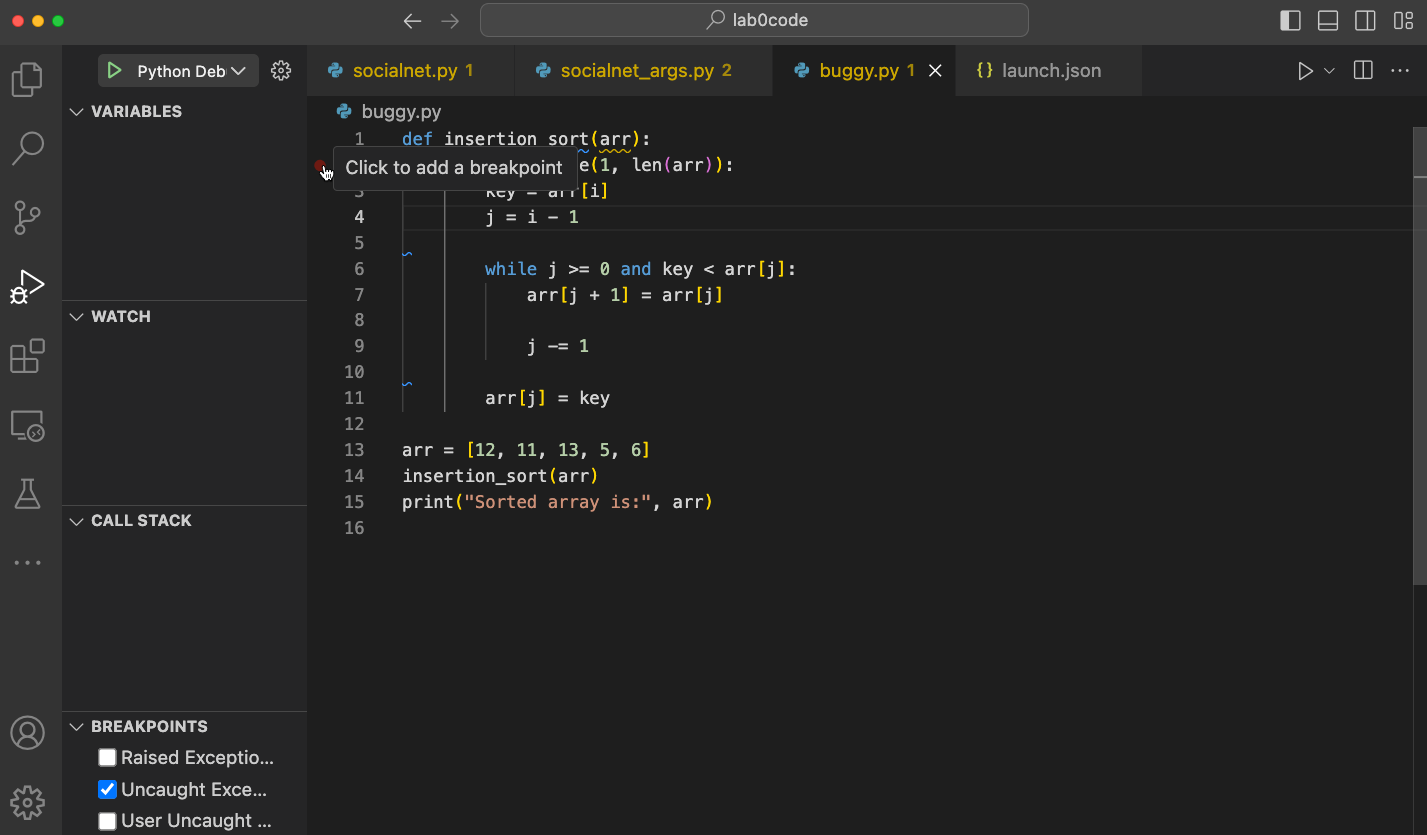
Figure 8. Add a breakpoint.
👉 Start the debugger. The execution should now pause at the breakpoint.
On the left, you should see the current value of all variables and a debug toolbar should appear (Figure 9).
The Call stack panel indicates that the instruction being currently executed is in function insertion_sort() defined in module buggy.py.
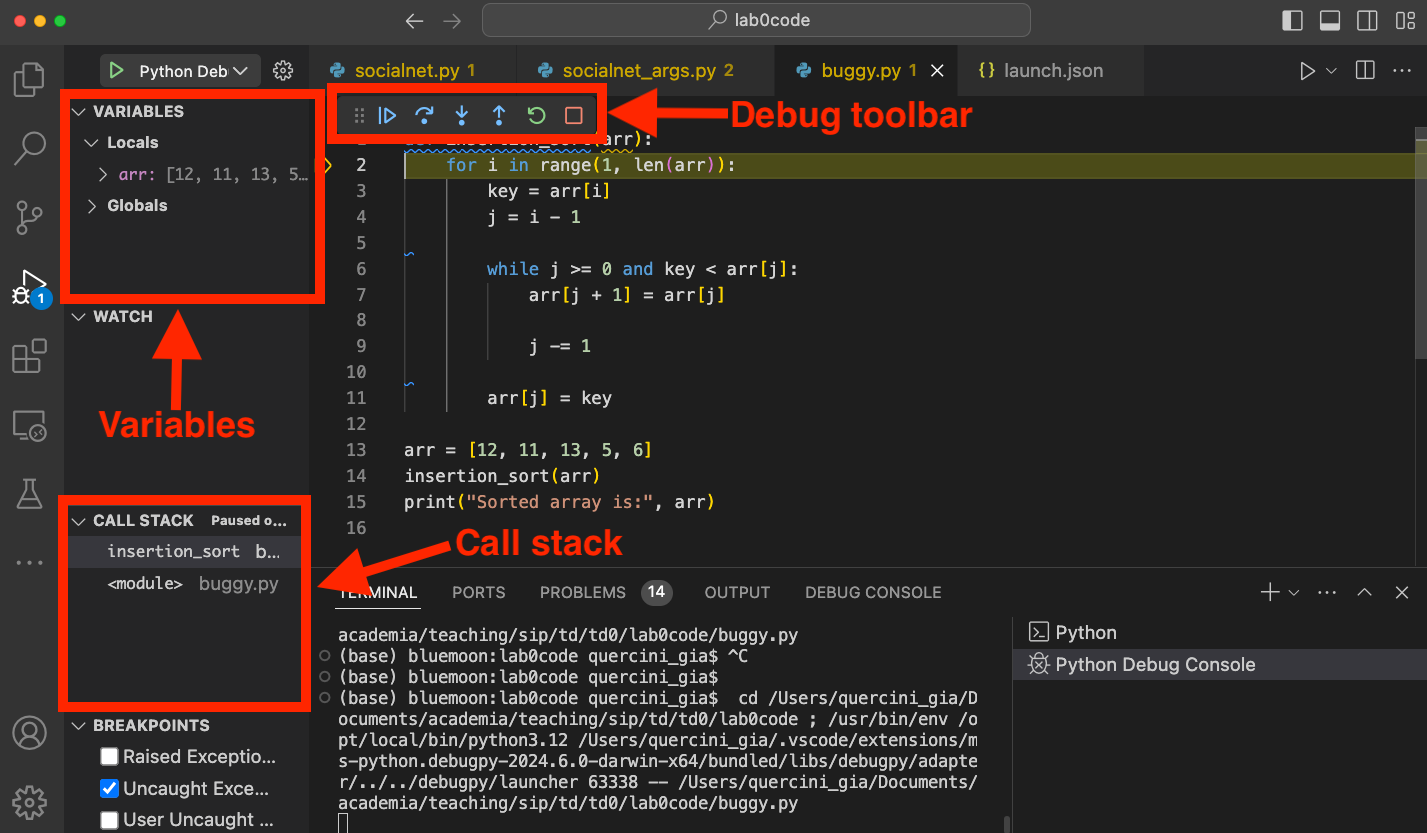
Figure 9. The debugger environment.
7.2 Debugger toolbar
We now learn how to use the buttons in the debugger toolbar.
If you need to restart the debugger at any time, you can click the button Restart ![]() .
.
👉 Make sure that you added a breakpoint, as instructed in Figure 8.
Click on the Continue/Pause button ![]() until the program terminates.
Each time you click on the button, observe how the values of the variables change.
until the program terminates.
Each time you click on the button, observe how the values of the variables change.
Describe the behavior of the debugger.
ANSWER ELEMENTS
Each time we click the button, one iteration of the for loop is executed and the execution pauses at the breakpoint.
When the loop ends, the script is executed till the end.
Do the following actions:
- Start the debugger.
- Disable the breakpoint: right-click on it and select
Disable Breakpoint. - Click on the
Continue/Pausebutton only once.
What happens? How is the behaviour of the debugger different from what you observed before?
ANSWER ELEMENTS
Initially, the debugger pauses the execution at the breakpoint. After removing the breakpoint, the execution is still paused.
When we click on the Continue/Pause button, the script is executed till the end.
The Continue/Pause button ![]() can also be used to pause a long execution.
can also be used to pause a long execution.
👉 Enable the breakpoint (right-click on the grey breakpoint and select Enable Breakpoint) and start the debugger.
Click on the Step Out button ![]() until the program terminates. Observe the values of the variables. What happens?
How is the behaviour of the debugger different from what you observed when you used the
until the program terminates. Observe the values of the variables. What happens?
How is the behaviour of the debugger different from what you observed when you used the Continue/Pause button?
ANSWER ELEMENTS
Like before, each time we click on the button, an iteration of the for loop is executed.
However, when the loop is over, the script is not executed till the end. Rather, it is paused at line 14, where the function insertion_sort() is called.
We understand that the purpose of the Step Out button, is to execute what remains of a function and exit the function (unless it bumps into a breakpoint, in which case it pauses).
👉 Restart the debugger.
Click the Step Over button ![]() a couple of times. What happens?
a couple of times. What happens?
ANSWER ELEMENTS
Each time we click the button, a single instruction is executed.
👉 Restart the debugger by clicking on the Restart button ![]() .
.
Click the Step Into button ![]() a couple of times. What happens? Is the debugger behaviour any different from when you used the
a couple of times. What happens? Is the debugger behaviour any different from when you used the
Step Over button?
ANSWER ELEMENTS
No, we obtain exactly the same behaviour.
👉 Remove the breakpoint by simply clicking on it, and add a new breakpoint at line 14 (where the function insertion_sort() is called).
👉 Restart the debugger by clicking on the Restart button ![]() .
.
Click the Step Over button ![]() only once. What happens?
only once. What happens?
ANSWER ELEMENTS
The function insert_sort() is executed as a single atomic instruction. The debugger did not go through each instruction of the function.
We may use the Step Over button when we intend to skip the details of the execution of a function because we feel quite confident that that function is not the culprit of the bug.
👉 Restart the debugger by clicking on the Restart button ![]() .
.
Click the Step Into button ![]() a couple of times. What happens? Is the result any different from when you used the
a couple of times. What happens? Is the result any different from when you used the
Step Over button?
ANSWER ELEMENTS
This time, the function insertion_sort() is executed instruction by instruction. We understand now the difference between the Step Over and the Step Into buttons.
👉 Stop the debugger by clicking on the Stop button ![]() .
.
7.3 Additional debugger functionalities
Before using the debugger to find the bug in script buggy.py, let's look at further debugger functionalities.
Manipulating variables
In addition to the Variables panel, you can look at the value of a variable by simply hovering the mouse over it (Figure 10).
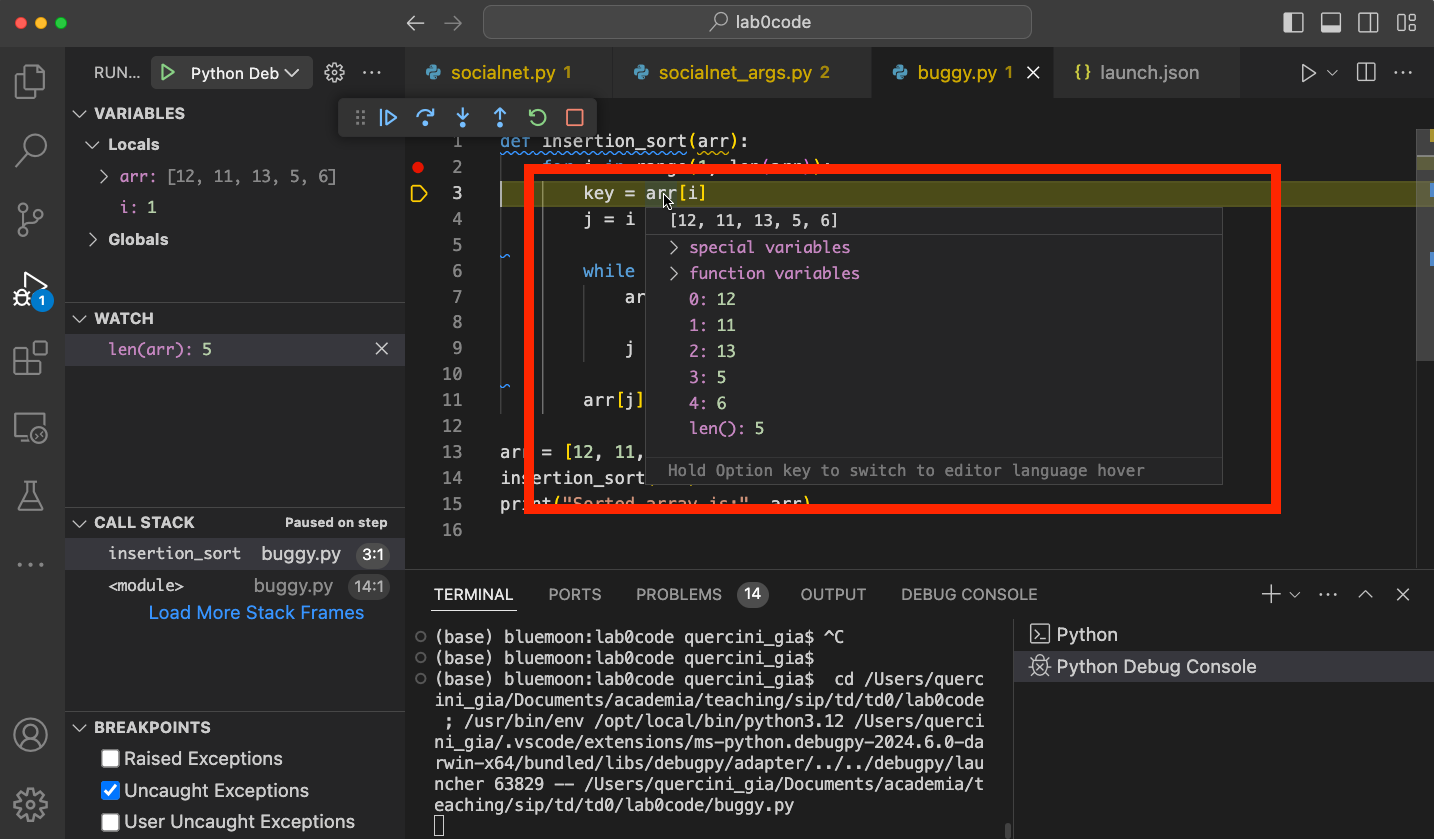
Figure 10. Current value of a variable.
You can add some expressions in the Watch panel (Figure 11). In our example, function insertion_sort() should not add any value to the input list. Therefore, we can add expressions to confirm that this is precisely the case.
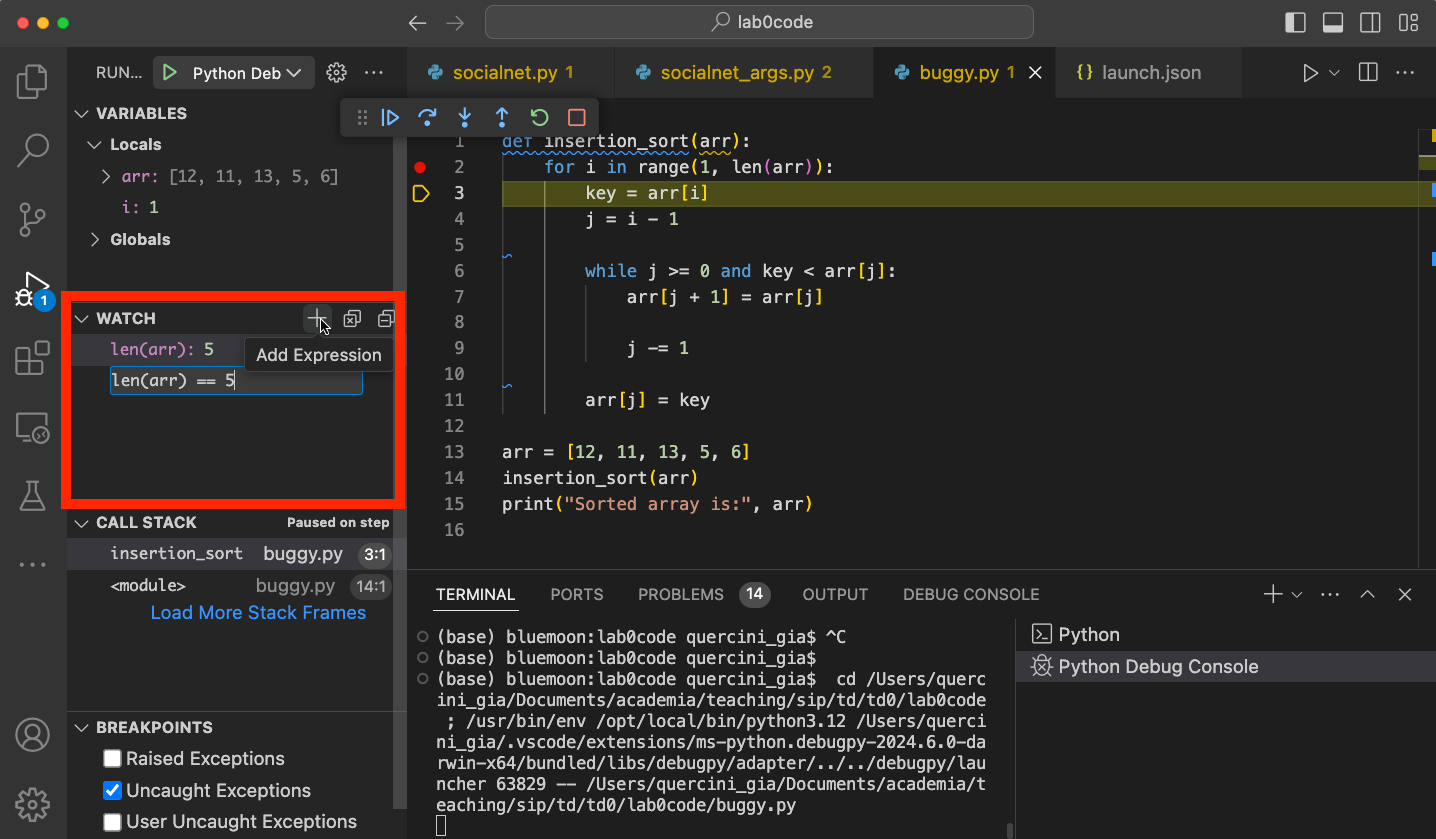
Figure 11. Add expressions to the
Watch panel.You can manually set the value of a variable by right-clicking on the variable name in the Variable panel (Figure 12). This is useful when you want to change the input to a function and observe its behaviour.
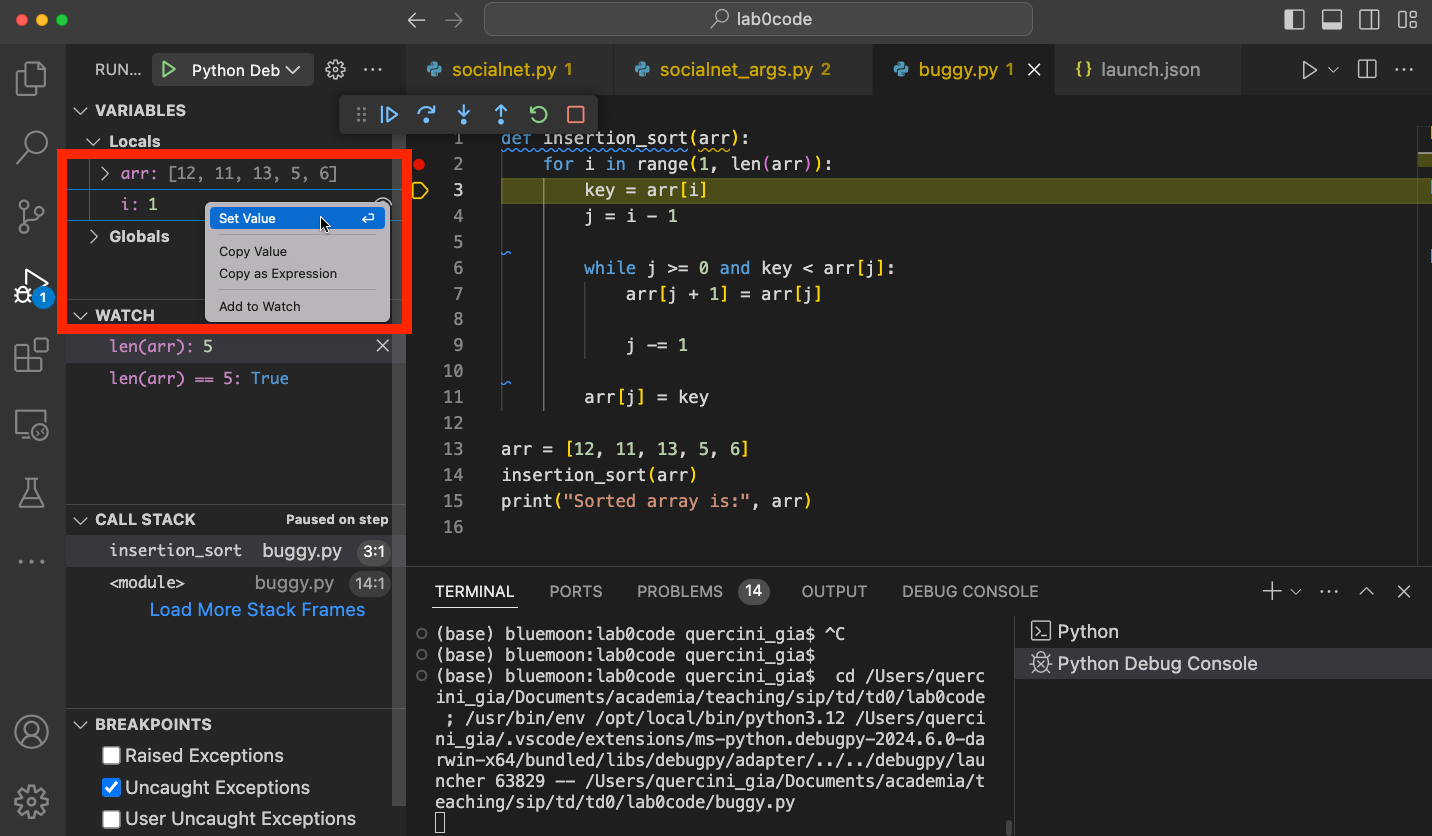
Figure 12. Set a new value of a variable.
Logpoints
Besides breakpoints, VSC provides another tool called a logpoint. The purpose of a logpoint is not to pause the execution of the program, rather to print a message when the execution reaches the logpoint. You can add a logpoint by right-clicking on the left of a line number and selecting Add Logpoint (Figure 13).
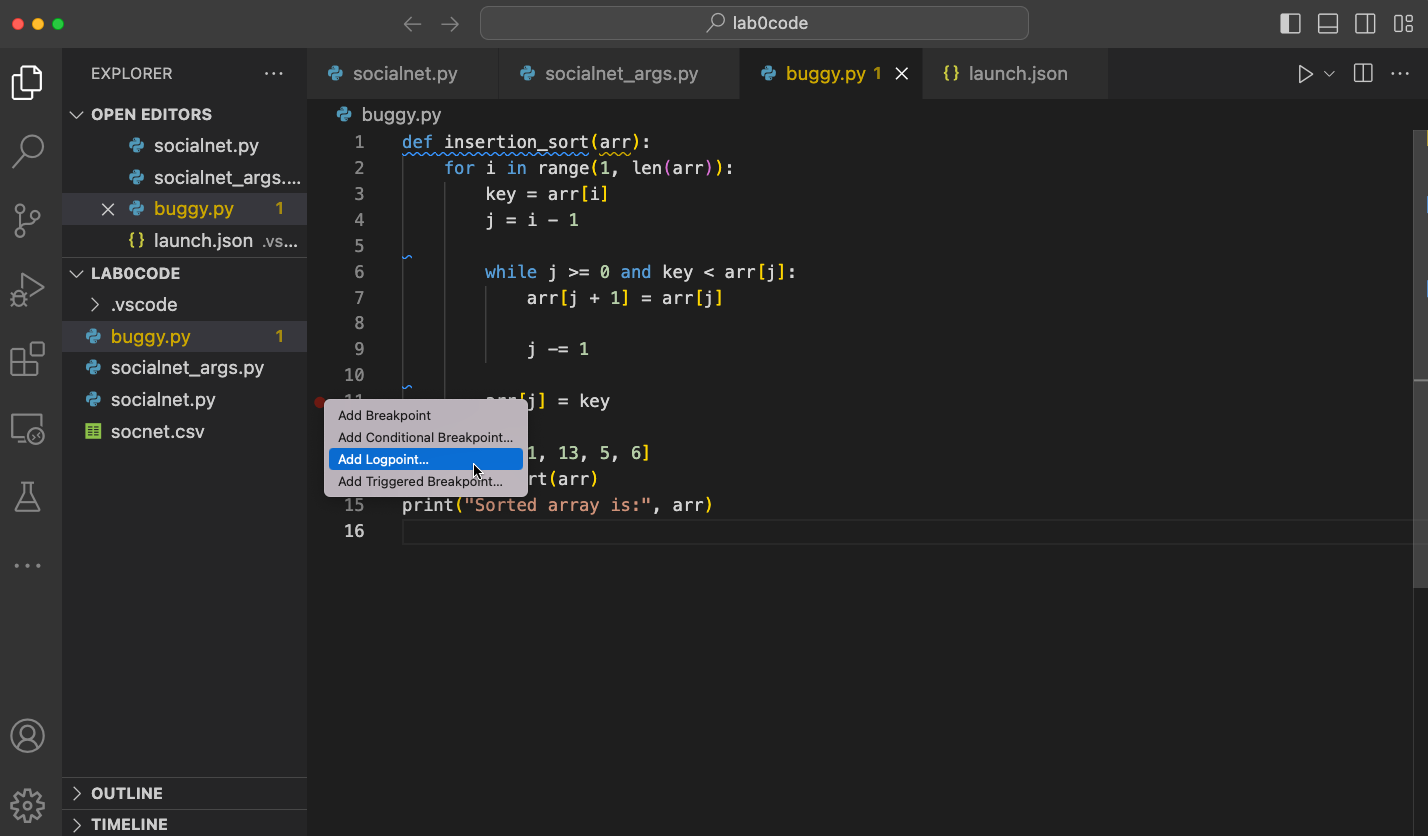
Figure 13. Add a new logpoint.
You can then specify a log message (Figure 14). The log message can also include Python expressions between curly brackets. In Figure 14, when the logpoint is hit by the execution of the program, the values {i}, {j}, {arr} and {key} will be replaced with the current values of the corresponding variables.
👉 When you're done editing the log message, you need to press the key Enter.
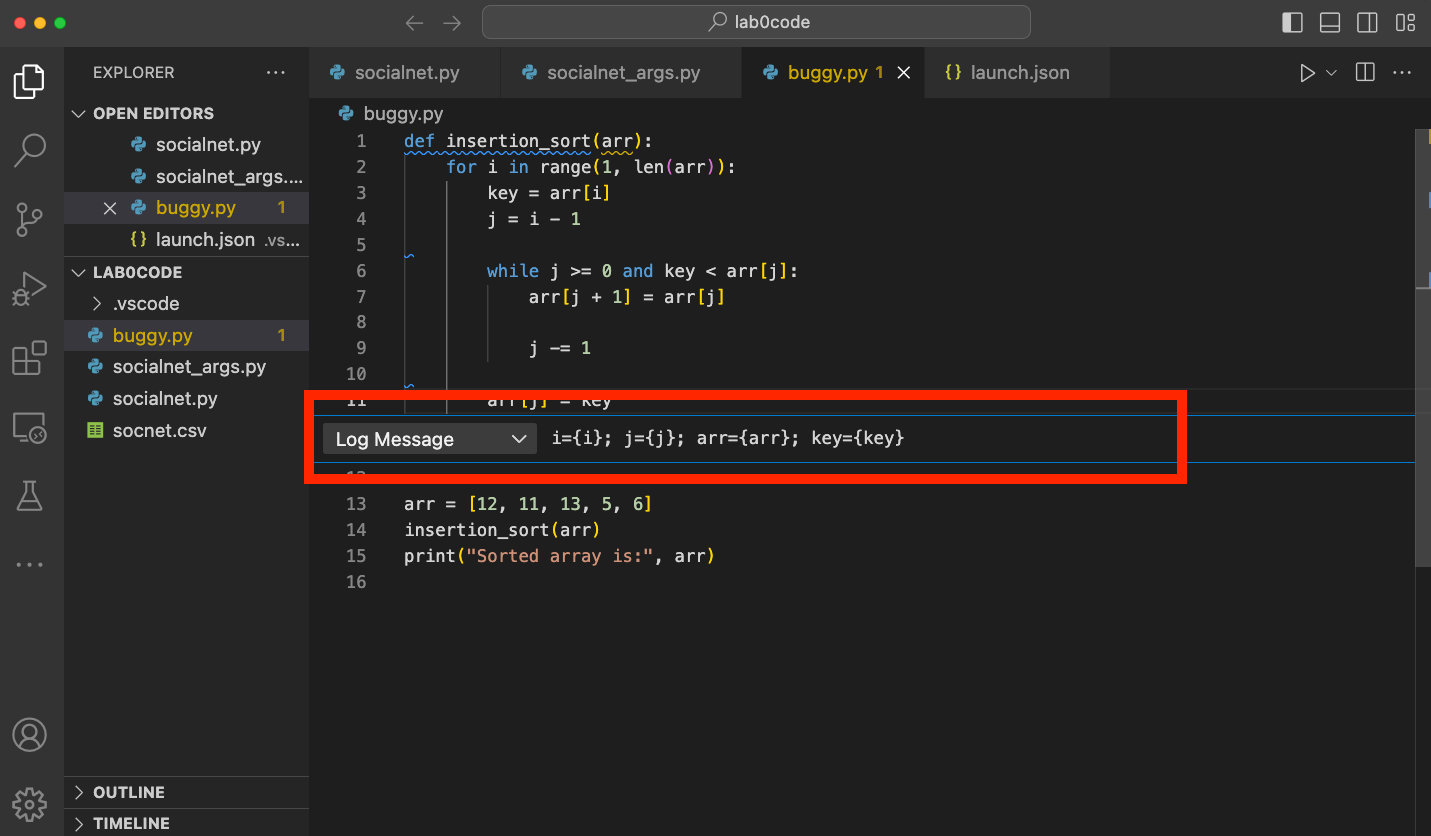
Figure 14. Edit the log message of a logpoint.
When you execute the debugger, the log messages will be displayed in the Debug console when the logpoint is hit (Figure 15).
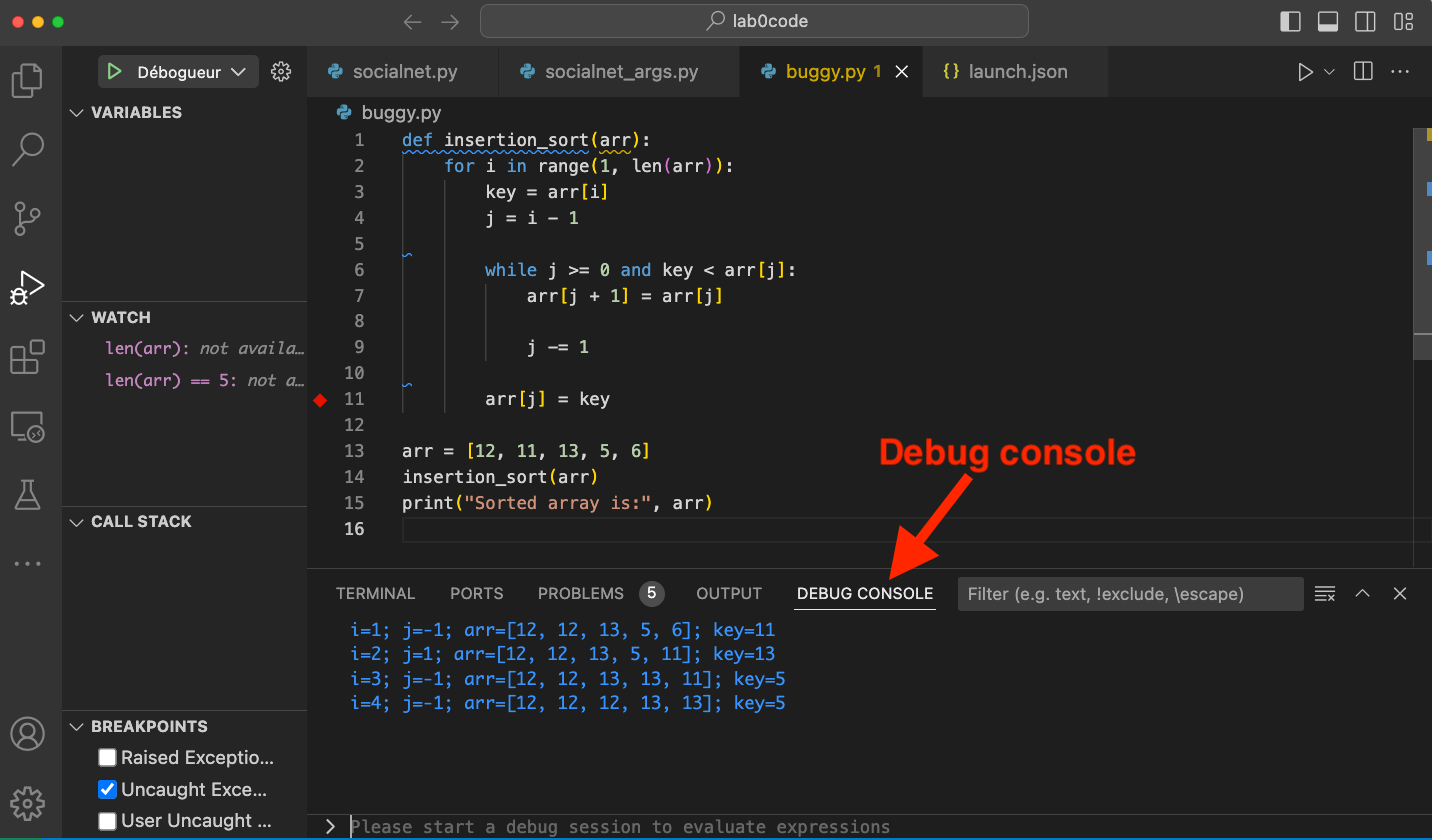
Figure 15. Log messages in the Debug console.
7.4 Find the bug
Use the debugger to find the bug in script buggy.py.
Fix the bug and confirm that the result is correct.
ANSWER ELEMENTS
If we place a breakpoint at the beginning of the while loop, and we execute the code instruction by instruction, we immediately realize that at the end of the first iteration the value 11 is placed at the end of the input list, instead of being placed at the beginning.
Now, at the end of the first iteration of the while loop, the value of the variable j is -1 (which indicates the end of the list).
The problem comes from the instruction at line 11, which should be arr[j+1] = key.
Further reading - Linting
In files socialnet.py and socialnet_args.py you should see blue and yellow underlines.
These squiggles are inserted by one of the extensions that you installed when you set VSC up: Pylint.
Pylint is a widely-used linter, a program that reads and analyses
the source code of a program to highlight problematic constructs that may result in an
error when the program is executed.
In 1978, Stephen C. Johnson, a researcher at Bell Labs, wrote a program that could detect a number of bugs and obscurities in C code. He named the program after the fluff on your pullover when you take it out of the washing machine: Lint.
Note that a linter does not execute a program to discover the issues; it does so by
only reading the source code. This process is referred to as static analysis.
👉 To read the Pylint messages, just hover the mouse over the underlines.
👉 The colour of the underline indicates the severity of the problem. Blue is used for any information as to conventions that are not respected in the code; yellow is used for warnings, something that might result in an error when the script is executed; red is used to point out severe problems, such as syntax errors that will definitely result in an error when the code is executed.
Can you understand, describe and fix each problem pointed out by Pylint in files socialnet.py and socialnet_args.py?
Here are a couple of tips to help you out:
- Some of the problems are about a missing docstring. A docstring is a string specified in the source code that is used, like a comment, to document a specific segment of code, such as a script, a module or a function. Feel free to look it up on the Internet to see how to add a docstring in the code.
- In file
socialnet_args.py, the call to the functionopen()is underlined. Read carefully the message shown byPylintand look at the documentation of the functionopen()to find out how to fix the problem.
ANSWER ELEMENTS
In file socialnet.py, two problems are pointed out:
- The first (underlined with a blue squiggle) indicates that the docstring of the function
common_friends()is missing. - The second (underlined with a yellow squiggle) indicates that the name
common_friendsis redefined from outer scope.
The first problem is about a missing docstring.
A docstring is a string specified in the source code that is used, like a comment, to document a specific segment of code, such as a script, a module or a function. Unlike comments, docstrings are retained throughout the execution of the program. This allows the programmer to inspect these comments at run time.
Docstring conventions are described within PEP 257 (PEPs, or Python Enhancement Proposals, are documents describing several aspects of Python, including coding styles and suggestions for new features).
A docstring documentation of a function should include: one line with a summary of what the function does; a blank line; more lines with details about the function, if any; a blank line followed by the arguments and the return value.
Here is an example for the function common_friends():
👉 Comments should always be written in English. This makes the code understandable to everyone. Same goes for the variable names.
def common_friends(friendships):
    """Returns the common friends of any two individuals in a social network.

    The function does not return symmetric pairs. The pair (a, b) is considered the same
    as the pair (b, a).

    Parameters
    ----------
    friendship: dict
        The input social network. Each key in this dictionary is the identifier of an individual.
        The value associated to an individual identifier is the list of friends of that individual.

    Returns
    -------
    dict
        Each key of this dictionary is a pair of identifiers of individuals (a, b);
        the associated value is the list of the identifiers
        of the common friends of a and b.

    """

    common_friends = {}

    for person1, person1_friends in friendships.items():
        for person2, person2_friends in friendships.items():
            if person1 != person2:

                key = (person1, person2) if person1 < person2\
                    else (person2, person1)

                if key in common_friends:
                    continue

                common = list(set(person1_friends) &
                              set(person2_friends))

                common_friends[key] = common

    return common_friends
After writing the docstring for function common_friends(), the linter should still underline with a blue squiggle the word def.
This is because a docstring should also be associated to the script as a whole, explaining what the script does.
To make the squiggle disappear, you can add the following docstring at the top of the script :
"""Definition and test of a function that returns common friends in a social network.

This script is only used for educational purposes.

"""
Always remember to leave a blank space after the end of a docstring.
The second problem is about using the same name (common_friends) to refer to two different things (a function and a dictionary).
This is indeed something that is discouraged. We may for example rename the function to find_common_friends().
The quickest way to rename a symbol is to right-click on the symbol and select the Rename Symbol option.
This will make sure that the symbol and all the references to that symbol are updated.
In our case, the function common_friends() is referred twice: when it is defined and when it is called.
If the option Rename Symbol does not appear, make sure the extension Pylance is installed and enabled.
If not, install it, activate it and restart Visual Studio Code.
In file socialnet_args.py, besides the problems discussed above, we also find:
- a problem at line 32, because we open a file without specifying its encoding. Just add
encoding='utf-8'to the arguments of functionopen(). - a problem at line 44, because we should leave one blank line at the end of a Python file. This is because some tools expect that the last character of a text file be a new line.
You should always carefully look at all problems pointed out by the linter. Not only does the linter help you using established programming conventions, but it also prevents you from getting errors when you execute a program.
More on Visual Studio Code
If you want to learn more about Visual Studio Code, we strongly recommend you the introductory videos available on the official website.